 V-Charts
2.0.4
V-Charts
2.0.4
With main focus on volume and volatility based technical indicators our V-Charts have full set of indicators for technical analysis of stocks, ETFs and indexes. Java based web version of these chart could be found on our web site (www.v-charts.com). Web based V-Charts are completely compatible with our V-Charts mobile app: whatever you do and save on your computer (set of technical indicators, analytical drawings and etc.) could be later accessed and worked with via our mobile V-Charts app. Our V-Charts is free mobile addition to our main charting service (web-based Java stock charts)
With our V-Charts you will be able:
- monitor stock market;
- perform technical analysis;
- save your work as chart styles;
- set sound and email alerts triggered by technical indicators.
With our V-Charts you will a have access to
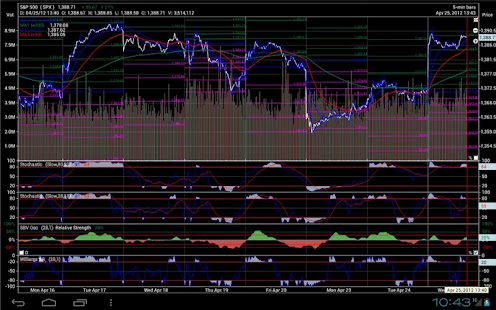
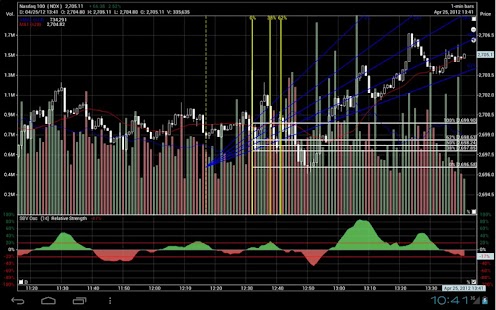
- monitor stocks in various frames (from 1-minute bars up to the monthly bars);
- analyze candles, Heikin-Ashi candlesticks;
- analyze more than 200 popular technical studies;
- analyze unique volatility, volume and advance/decline indicators;
- much more…
After you get you V-Charts app, if you are not already our subscriber, you will be asked to register on www.v-charts.com to receive username and password.
Keywords: stock market, charts, stock charts, technical analysis, stocks, index charts, technical indicators, studies, market analysis, market charts, investing, trading, stock, chart, charting, stock trading.
With our V-Charts you will be able:
- monitor stock market;
- perform technical analysis;
- save your work as chart styles;
- set sound and email alerts triggered by technical indicators.
With our V-Charts you will a have access to
- monitor stocks in various frames (from 1-minute bars up to the monthly bars);
- analyze candles, Heikin-Ashi candlesticks;
- analyze more than 200 popular technical studies;
- analyze unique volatility, volume and advance/decline indicators;
- much more…
After you get you V-Charts app, if you are not already our subscriber, you will be asked to register on www.v-charts.com to receive username and password.
Keywords: stock market, charts, stock charts, technical analysis, stocks, index charts, technical indicators, studies, market analysis, market charts, investing, trading, stock, chart, charting, stock trading.
Fotogalerie
-
Verze programu
2.0.4
-
Poslední aktualizace od vývojáře
22. 9. 2017
-
Počet stažení za měsíc
0 ×
-
Velikost
77 kB
-
Potřeba instalace:
Ano
-
Web autora
-
Podporované jazyky
- Angličtina
Zdarma
Sdílet
Podobné programy


TIP: Stahují se vám programy pomalu? Změřte si rychlost svého internetového připojení.